ProjectData · Strategy
Coupon Acceptance Prediction
Coupon acceptance → highway amenity strategy
An NYU analytics project reframed as a planning brief: model which drivers accept coupons, then tell highway planners which amenities to actually build.
Filed underAnalystConsultantMarketing
§01Context
An NYU analytics project (IE-GY 9113) reframed as a real planning brief: an analytics team advising the amenity design of an interstate highway. By modeling which drivers accept promotional coupons — and why — we could tell planners which amenities to actually build. Stakeholders: the highway design team, amenity vendors, and interstate planners. I was the Data Architect & Analyst.
§02What I did
- Owned the data pipeline: handled 10,505 missing cells (the 'car' column was 99% empty and dropped), then engineered 57 features — ordinal encoding for age/income/education, one-hot for nominal fields like destination, weather, and occupation.
- Engineered an `expiration_hours` feature that became a top predictor, and ran EDA showing the real drivers were visit frequency, income, and social context — not physical factors like weather or distance.
- Benchmarked four model families with 5-fold CV, tuned the winners (Random Forest, Gradient Boosting) via randomized search, and scored the 2,684-record holdout.
§03Outcome
- Gradient Boosting won: 76.65% accuracy, 80.07% F1, 0.84 ROC-AUC (0.78 precision / 0.82 recall on acceptance).
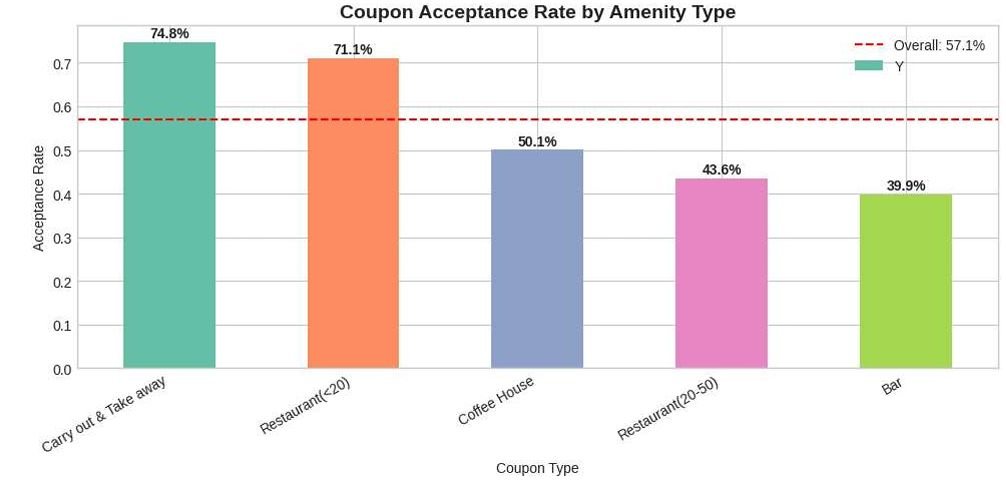
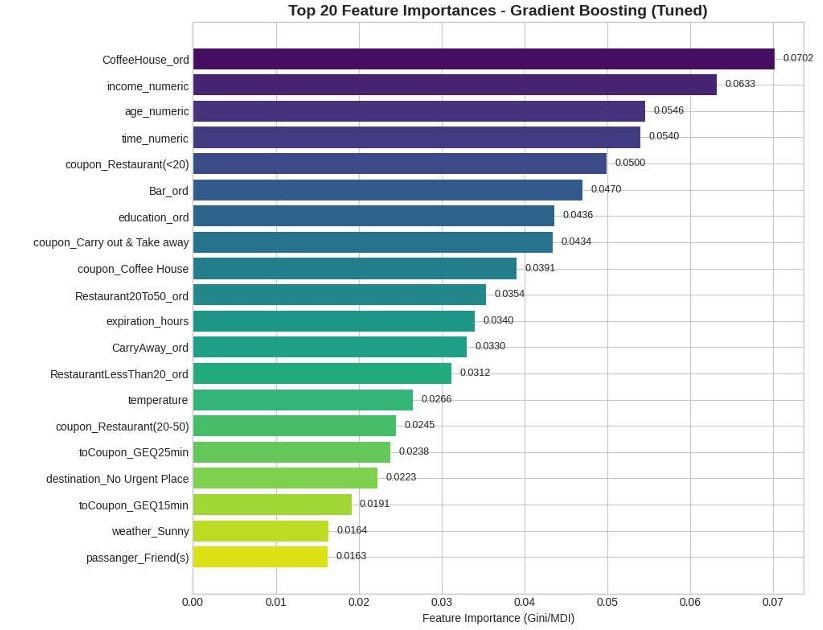
- Top predictors — coffee-house frequency, income, age — drove a 'priority amenity' strategy: coffee houses and quick-service/carry-out as anchors, affordable youth-oriented brands, and 1-day coupon windows over high-pressure 2-hour ones.
- Scored 2,684 new drivers (58% predicted likely acceptors), turning the model into an interstate design recommendation.
§04From the analysis
A model that didn't stop at accuracy — it told planners what to build.